TIA Daily COVID-19 Update: April 23rd
As TIA continues to monitor the situation surrounding COVID-19 and it’s impact on the 3PL and transportation industries, here is your Daily Update for April 23. As a reminder, you can find all the latest information, resources, guidance, and news from TIA’s COVID-19 Response Center.
FEDERAL GOVERNMENT UPDATE:
The House is set to pass the additional relief package this afternoon that was passed by Senate on Tuesday, sending it to President Trump to sign into law. Work is also underway on Phase IV of the relief efforts. We expect that package to be considered around mid-May.
LUNCH & LEARN UPDATE:
Thanks to everyone who joined us this afternoon for our Virtual Lunch & Learn webinar, Sales Strategies for Uncertain Times, presented by Bill Bartlett. As a reminder, all of TIA’s Virtual Lunch & Learn webinars are available on-demand.
TIA UPDATE:
There was a guest editorial in yesterday’s Wall Street Journal from Kurt Huffman, a restaurant owner, about the challenges of enticing idled employees back to work. The editorial, Our Restaurants Can’t Reopen Until August, addresses the unintended consequence of Congressional action. Mr. Huffman states that the starting wage for a line cook in one of his restaurants is $15 hour. The cooks receive at least $1 an hour in tips, so at a minimum, they make $16 an hour, or $640 before taxes for a 40-hour week. Normal Oregon unemployment would have paid the cooks $416, with the $224 a week shortfall acting as an incentive to find a job.
With the CARES Act, however, those workers are now receiving $1,016 a week, or $376 more than if they were employed, an hourly rate of $25.40. The extra CARES Act payments run through July 31, which is why Mr. Huffman states that he will not be able to fully open until August. This same knock on effect will translate into every hourly business.
INDUSTRY UPDATE:
Each week Truckstop.com publishes a summary of their spot market data in a document called Trans4Cast. The summary is available for free to all their customers. If you are a Truckstop.com customer, I strongly recommend you make that report your regular early week reading. The two most revealing data sets in the report are summarized below. The first, the Truckstop.com Market Demand Index (MDI) is the ratio of loads posted to trucks posted.
As such it is a rough, but useful proxy for capacity utilization, or market tightness. If a lot more loads are posted than trucks, the index goes up, indicating a tight market and vice versa. In the example below you can see the surge in tightness from the “hoarding” effects of the virus (Weeks 6-11 to the right) followed immediately by a collapse in tightness as all the business closed due to the Governors’ restrictions (latest weeks to the right). One hopes that the little curl in the drop at the bottom right is evidence that we have reached a floor. For comparison, the lowest reading for this index during the Great Recession was below 3.
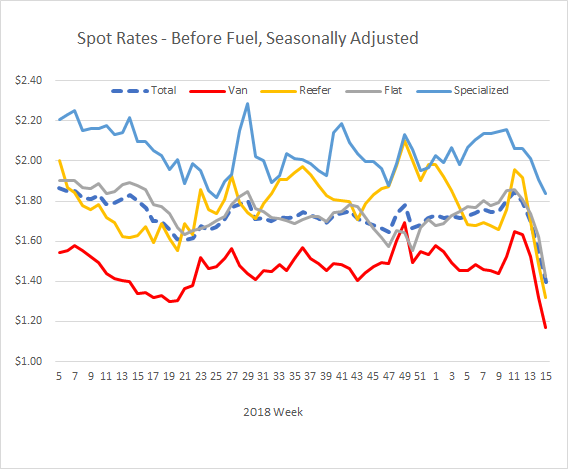
Reaching a floor is important because of what we see in the second graph, a picture of the rates offered by people posting on Truckstop.com’s load board. The graph shows that the already low spot rates levels have collapsed over the last three weeks in response to the loosening of the market shown in the first graph. One hopes that we are nearing a floor. For comparison, the lowest readings for posted rates during the Great Recession were ten cents per mile below the current levels. Note that the data is presented seasonally adjusted to reveal the underlying market forces free of confusing seasonal effects.
One final point: In a market starved for good, real-time data, this Truckstop.com data is a major asset. It and several other such sources all help businesspeople understand what is going on in times of stress, as things are happening, rather than guessing and then studying data months or years after the facts to see if the guess was accurate. In a time of such rapid change, companies who are alert to such data and in possession of contingency plans will have a major advantage.
NOËL PERRY UPDATE:
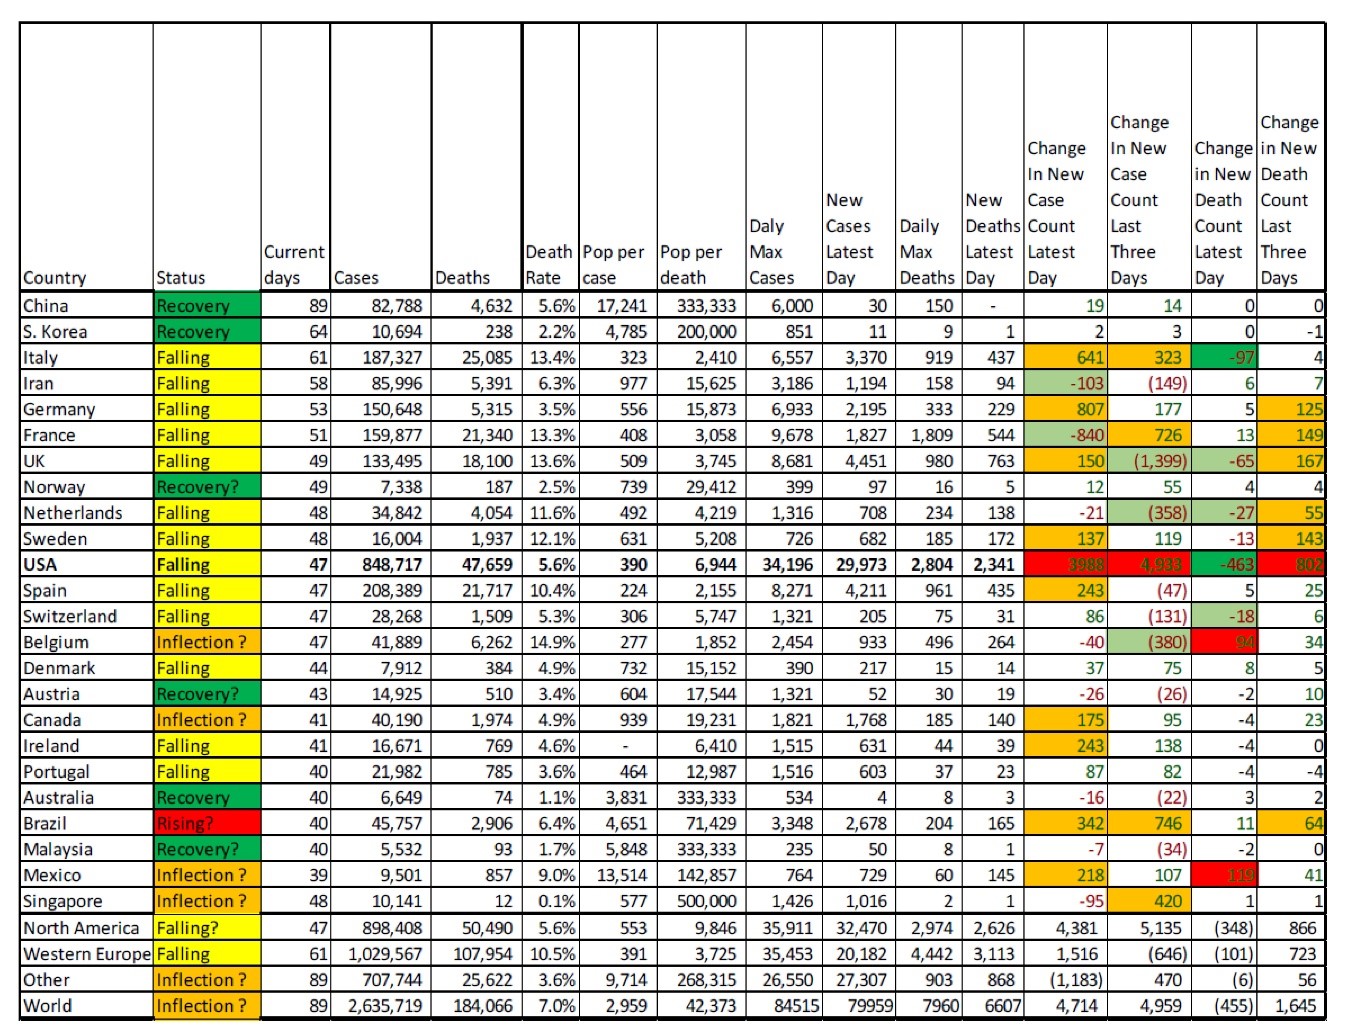
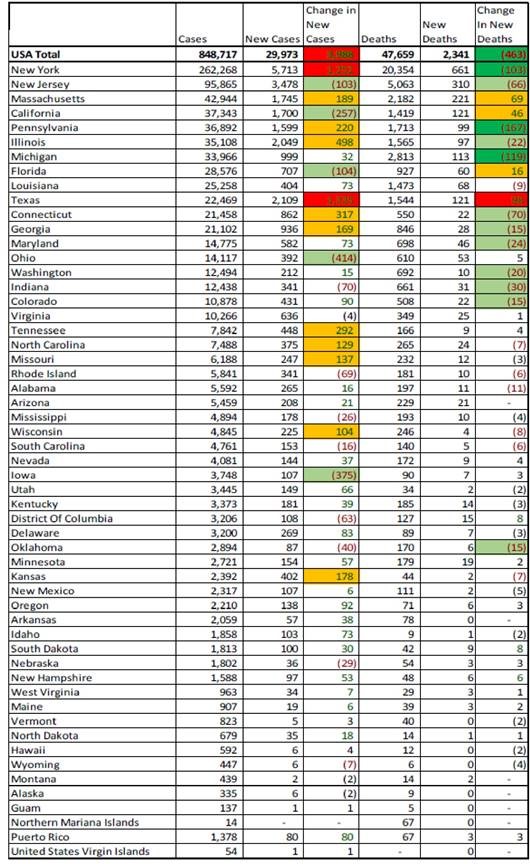
Wednesday was a mixed day as is typical of mid-week days. The U.S. case count was up significantly, influenced strongly by New York and Texas. From here on we will be presenting the state breakouts (Exhibit 2.) so that you may see where caution is most necessary and where relaxation of restrictions is likely.
To the good, there is lots of green in the U.S. death count change, save only Texas. We are hopeful that such a midweek reduction is a sign of the long-awaited inflection point for U.S. deaths per day. Europe was also down in deaths, although up modestly in new cases, notably in Italy.
To illustrate the difficulty of interpreting these statistics we have learned that some states are including their “probable’s” counts, situations where the cause of death was unclear.
We’ll be back tomorrow with COVID-19 updates and information that came through overnight.
Enjoy Tex Beneke and the Glenn Miller Orchestra as they play “Gal in Calico.”


Alliances