by Chris Eudy
In certain parts of the country, the grass is starting to turn green, and buds are beginning to appear on the trees. Spring will soon be upon us, and with it, the produce season. Tomatoes, strawberries, and other fruits and vegetables are set to make their way from the Southeast and California to the rest of the country. Produce season, as it always does, will have a tremendous impact on reefer volume, capacity across the board, and pricing.
Brokers across the country are asking: When will produce season hit (and where)? How will this impact capacity? How much will prices go up as a result of diminished capacity?
When
While DAT doesn’t have a crystal ball, we do have the next best thing: industry experts Dean Croke and Ken Adamo. Produce season can, and often does, start anytime between mid-March and April at various points across the southeast and California (but that is a huge window to try to plan around).
Ken and Dean host a weekly market update show, DAT iQ Live, that discusses the impact of major events, like produce season, on the market. Their latest show can be found here.
One of the challenges with produce season is the weather. It can have a huge impact on the viability of crops and how many make it out of a certain region of the country. For example, tomato and strawberry season is set to begin in southern Florida. Those volumes are currently down over 30%. When do we expect those volumes to increase and begin moving northward along their traditional route? Stay tuned to our market updates for more information.
How
Now we have to ask the question of how the produce season impacts the freight market and expected supply and demand (which will no doubt have a downstream impact on price).
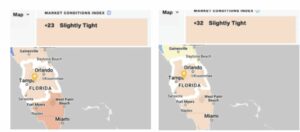
Going back to the example of Southern Florida produce, typically that means tightening capacity for reefer and dry vans out of Florida. The reason van capacity also tightens is because sometimes, when reefers aren’t shipping refrigerated goods, they ship non-refrigerated goods and act as extra capacity to the dry van space. The table below shows DAT’s MCI index for southern Florida.
The MCI index scores market tightness or looseness on a -100 to +100 scale (with +100 representing an extremely tight market). Market tightness associated with produce season typically means linehaul costs go up as it’s harder to find capacity.

How much
Finally, the million-dollar question: How much does the produce season impact the cost of freight on a given lane? The answer is, potentially, a lot.
Below are snapshots from DAT’s RateView and Ratecast tools. Both are looking at reefer spot freight from Lakeland, Florida to Atlanta, Georgia. Historically, starting in March, freight out of Lakeland begins to increase until it crescendos in May. Booked rates increased from an average of $800 to $1,200 (that’s an increase of 50%!) in 2023. This year, we are projecting a similar spike but with a peak average of $1,038. As you plan out your RFP strategy and calculate your margins, this $162 difference can be the difference between making or losing money.
While planning for the produce season can seem like a daunting task, DAT is here to help. Please reach out to your customer success representative or account manager today for any questions you have or support you may need.
Not sure where to start? Try these resources.
New to the market and looking to win produce freight? Check out our Pricing 101 guide to understand the ins and outs of pricing to win new business and expand your area of expertise.
Keeping shippers and carriers informed of your brokerage’s services is the key to growing your business. In our Marketing 101 guide, learn more about how to get in front of the right audiences and keep your business top of mind during produce season.
Weekly updates
Stay up to date with market trends and where freight rates are trending. Join our DAT experts, Ken Adamo and Dean Croke, weekly on DAT iQ Live or check out DAT’s Trendlines to have the most updated information available to drive your freight decision making.
Additional resources


